f <- function(x) x + 1
g <- function(x) f(x)
g("a")12 Debugging R code
R scripts are great things, when they work. What are some strategies you can use when things go sideways and an error occurs in your script?
12.1 Debugging your own code
The most common case you will run into a bug is when writing new code yourself. Often the mistake is obvious and easily fixed, but sometimes it only appears after multiple levels of calls and is harder to diagnose. There are a few common strategies to use when debugging your own code.
- Use
traceback()to determine where a given error is occurring. - Output diagnostic information in code with
print(),cat()ormessage()statements. - Use
browser()to open an interactive debugger before the error - Use
debug()to automatically open a debugger at the start of a function call. - Use
trace()to start a debugger at a location inside a function.
12.1.1 traceback()
The traceback() function can be used to print a summary of how your program arrived at the error. This is also called a call stack, stack trace or backtrace.
In R this gives you each call that lead up to the error, which can be very useful for determining what lead to the error.
You can use traceback() in two different ways, either by calling it immediately after the error has occurred.
#> Error in x + 1 : non-numeric argument to binary operatortraceback()#> 2: f(x) at #1
#> 1: g("a")Or by using traceback() as an error handler, which will call it immediately on any error. (You could even put this in your .Rprofile)
options(error = traceback)
g("a")#> Error in x + 1 : non-numeric argument to binary operator
#> 2: f(x) at #1
#> 1: g("a")12.1.2 print()
Once you know where an error occurs it is then helpful to know why. Often errors occur because functions are given inputs their authors did not expect, so it is useful to print the value of objects during execution.
The most basic way to do this is to sprinkle messages throughout your code, with print() or str(). str() is often more useful because it gives more detail into the exact structure of an object, which may not be the structure you expect it to be.
The main downsides to the print approach is you often have to add them in multiple places to narrow down the error, and you cannot further investigate the object.
12.1.3 browser()
A more sophisticated debugging method is to put a call to browser() in your code. This will stop execution at that point and open R’s interactive debugger. In the debugger you can run any R command to look at objects in the current environment, modify them and continue executing.
Some useful things to do are
- Use
ls()to determine what objects are available in the current environment. This allows you to see exactly what things you can examine. - Use
str(),print()etc. to examine the objects - Use
nto evaluate the next statement. Usesto evaluate the next statement, but step into function calls. - Use
whereto print a stack trace - Use
cto leave the debugger and continue execution - Use
Qto exit the debugger and return to the R prompt.
12.2 Debugging in RStudio
12.2.1 Editor breakpoints
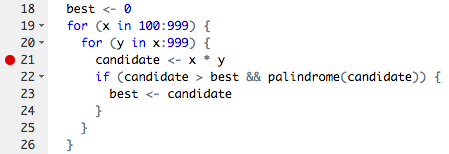
RStudio provides some additional tooling for debugging over using R on the command line. First you can set an editor breakpoint by clicking to the left of the line number in the source file, or by pressing Shift+F9 with your cursor on the line. A breakpoint is equivalent to a browser() call, but you avoid needing to change your code like browser().
12.2.2 Stopping on error
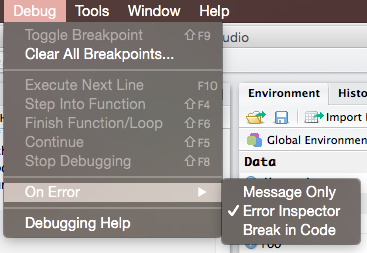
If you are trying to hunt down a particular error it is often useful to have RStudio enter the debugger when it occurs. You can control the error behavior with (Debug -> On Error -> Error Inspector).
12.2.3 Debugging console
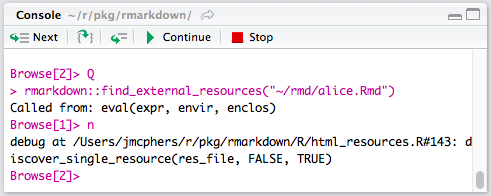
The RStudio debugging console has a few buttons to make debugging a little nicer, From left to right they are, next (equivalent to n), step info (s), continue (c) and Stop (Q).
12.3 Debugging others’ code
When the error is occurring outside of your own code it is also useful to be able to debug the code. In this case you could download the package code locally and debug it like you would with your own code above by adding print() and / or browser() calls. Because R and most R packages are open source this is a perfectly viable option and one I often do myself. However depending on the package this can sometimes be challenging, particularly for those packages which come with R itself.
The other option is to use additional functions which allow you to start a browser in existing functions, recover(), debug(), trace() .
12.3.1 recover()
recover() is not used directly, instead it is used as an error handler, by calling options(error = recover). You can also use other functions, such as browser() as an error handler, which will start the debugger automatically when there is an error.
The benefit to recover() over using options(error = browser) is that you can browse on any of the call stack, not just where the error occurred. Often the issue is most easily diagnosed in calls higher on the stack than immediately where the error occurred.
When recover() is called it prints a list of the current calls, with a prompt to select which you want to browse in. Then a debugging session is started at that location.
Note
Try activity 1 usethis::use_course("rstd.io/wtf-debugging") Try activity 2 usethis::use_course("rstd.io/wtf-debugging")
to practice debugging errors using the tools described
12.3.2 debug()
If you have control of the code (because you are the one writing it), using browser() is generally the most convenient way to enter the debugger. However if the error is occurring in code in a package what options do you have?
This is where the debug() function is useful, it will open the R debugger on any function, including those in packages.
debug(ggplot2::ggplot)Use can use the :: syntax to find ‘exported’ functions in a package, but there is also a way to access any function, including un-exported ones, :::.
debug(ggplot2:::set_last_plot)undebug() is used to remove the debugging code.
12.3.3 trace()
debug() is very useful, but one drawback is it always executes the first time a function is called. What can you do if the bug only happens the 100th time a function is called?
trace() is a more flexible version of debug() that not only lets you start a debugger at the start of a function, it lets you insert any code at any location in a function. The downside to this power and flexibility is that trace() is comparatively harder to use than debug().
If called with no additional arguments trace() simply prints a message when the function is entered.
If called with a function as the second argument this inserts the function at the start of the function. trace(fun, browser) is functionally equivalent to debug(fun). browser() or recover() are generally the most useful functions to use, but this could actually be any R function or even regular R expressions. This is often useful to open the debugger only when a certain condition is met.
trace(print, quote(if (is.numeric(x) && x >= 3) cat("hi\n")), print = FALSE)Tracing function "print" in package "base"[1] "print"print(1)[1] 1print(3)hi
[1] 3# Use untrace to remove the tracing code
untrace(print)Untracing function "print" in package "base"You can also use the at argument to trace() to insert the tracing expressions at other points in the function body. To determine the number of the expression to insert convert the body of the function to a list. e.g. as.list(body(fun)).
Note
Try activity 3 usethis::use_course("rstd.io/wtf-debugging")
to explore using trace() with at.
12.4 Debugging in R Markdown documents
One special case where it can sometimes be more difficult to debug is an error that occurs only when knitting an R Markdown document.
The easiest way to debug most of the errors is to simply run the code inside the chunk as regular R code in the console and use the normal techniques such as inserting browser() calls.
However rarely an error will only occur when the code is being knitted. In this case you can set an error handler with the following code.
First you will need to modify recover slightly, by adding a sink() call to the beginning, which disables the sink used by knitr internally. We do this by using trace(). This can be run in a setup block or in your R console before calling knitr::knit() / rmarkdown::render()
trace(recover, sink)Then add the following knitr chunk options to the chunk which is failing. error = FALSE, R.options = list(error = recover).
Then knit the file on the R console with knitr::knit() or rmarkdown::render(). The traceback will contain all of the knitr calls as well, so you will need to look near the end to find the calls in your code.
Warning
Note you cannot use the ‘Knit’ button in RStudio when trying to debug R Markdown documents in any case. The ‘Knit’ button opens a separate R process, so there is no way to use an interactive debugger in that case.